Predict the Adoption of Your Social Business Initiative – Part 2
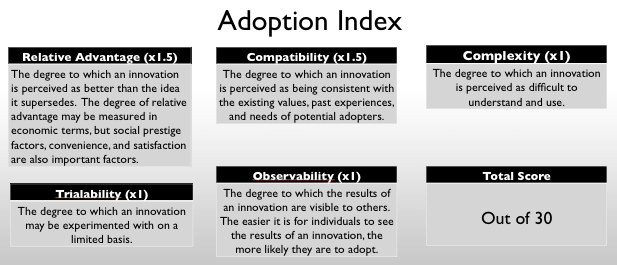
Now that you know the five factors to predict the rate of adoption of your initiative (whether it be social technologies, cultural change, etc.), let’s put this into something that will give us a measurement.
First, you have to pick your target audience. Know who you want to evaluate a tool. Then, take each one of the five and evaluate your initiative against it. Next, rate it – 0 through 5, with 0 signifying that it does not satisfy the factor at all, and 5 signifying that it is very strong in fulfilling this need.
Then mutilply the first two factors, Relative Advantage and Compatability, by 1.5 and the others by 1. Why? The first two hold more weight and are particularly telling (according to Rogers). If they all scored 5 then the total score would be 30.
I thought about ranking the results (1-30 = Weak …. 85-100=Strong), but I don’t feel that it is needed. Anyone who sees a 75% can tell that there is room to grow and will know where to focus to make is stronger. Again, it is not so much a crystal ball as it is a gauge to help us know where to focus our efforts to increase adoption.
Solving Real Work Problems
Two strengths of this tool are: 1) To quickly find where the holes are and 2) Explain in simple terms why an initiative was or was not (or will or will not be) adopted.
As I have used this, I have found that there are two types of adoption to account for. One is Initial Adoption, the other is Sustained Adoption. They are both very different and can show different results.
As an example, there is one particular technology I have heard many employees at different companies talk about. It spreads like wildfire at the beginning. The executives get excited that it is working: many people sign up and start using it. But not long after, usage drops off and only a very small fraction of people use it. (In one company with 2 years of using it, there are over 6000 registered users, 25 regular users and 35 using on any given day). Not only is management frustrated, but so are the employees. The result: it isn’t used often.
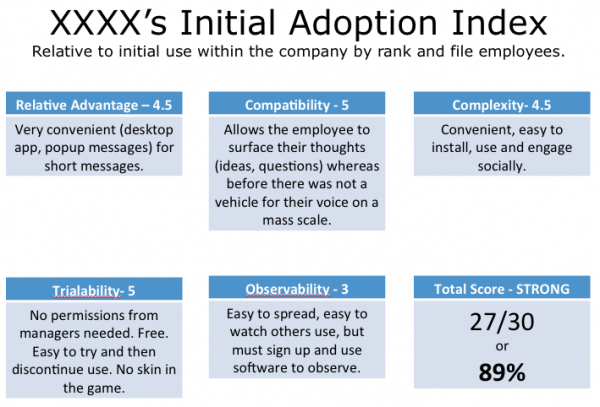
To explain this phenomenon, I evaluated it using the Adoption Index.
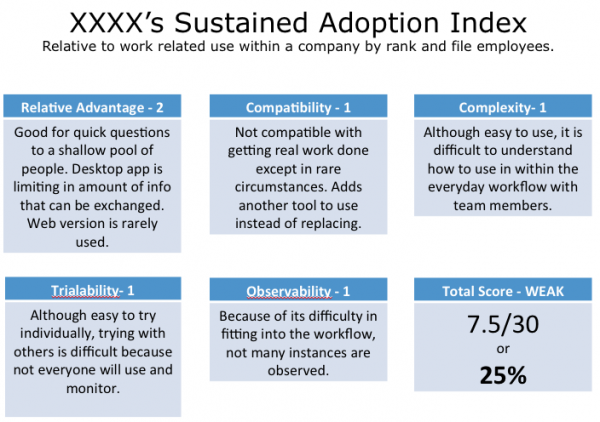
Looking at the above analysis (although this version does not go into depth for display purposes), you can understand why it is initially adopted quickly. Yet why is it not used after initial adoption? Why do employees drop it? Again, I use the Adoption Index to explain this.
There is more behind this analysis, but these are the bare basics. This is only one example of how the Adoption Index can help explain why an innovation or technology will or won’t be adopted.
This tool will give you direction on where you should spend your efforts. For example, if your score is low in complexity, you will know where to spend your time and how to focus to make your initiative more successful.
I have used this with initiatives to simply explain to executives and management why their products or initiatives were not as successful as they had hoped. Unfortunately, I have not used it to show why their efforts were much more successful than they anticipated, only because this rarely happens. But I hope to one day.
Feel free to use and give suggestions on how to make it better. I hope it will help you explain past initiative’s adoption rates and predict future ones. Here it is in PowerPoint format.
![]()
Adoption Index by Kevin D. Jones is licensed under a Creative Commons Attribution-ShareAlike 3.0 Unported License.
Based on a work at Diffusion of Innovations by Everett M. Rogers.


